
AAPL Daily (click to enlarge)
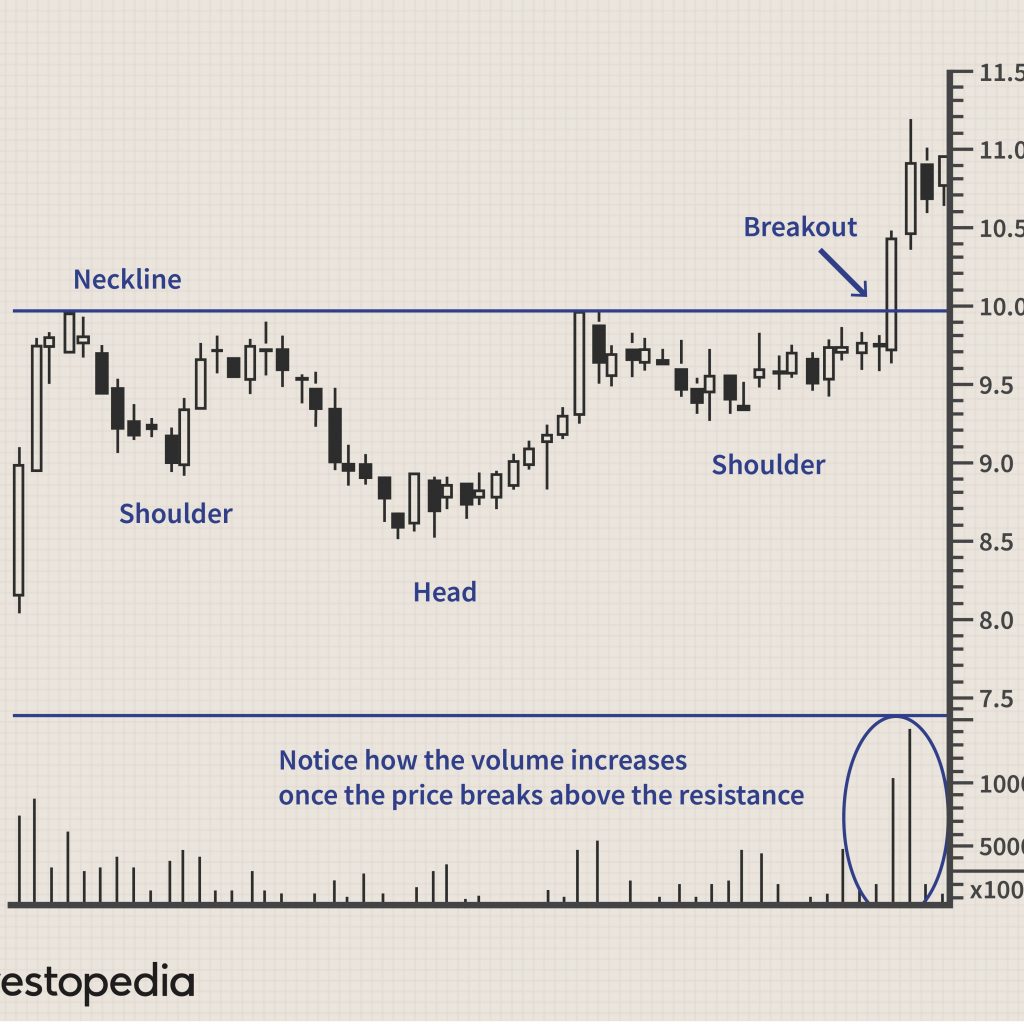
There are a number of indicators that suggest the Head and Shoulder breakdown may fail, thus creating a false breakdown and changing the pattern from a bearish reversal to a bullish continuation. This is not conclusive, as I spelled out the possible scenario a few days ago.
The fact of the matter is that Technical Analysis is not a science, even though the moniker “Technical” would suggest so. It is simply an examination of past price action, that might suggest future behavior. And anyone that thinks they can tell the future based on evidence from the past is delusional.
However, patterns do emerge, and there are statistical probabilities that can be associated with them. Perhaps enough so that you feel you have an edge. The problem is that most people don’t apply TA uniformly, they can’t, because it’s like a religious text…everyone has their own interpretation.
Technical Analysis is really what we call a SWAG, which is an acronym for Scientific Wild Ass Guess. It’s scientific to some extent because we use statistics and geometry to plot out the patterns. It’s a wild ass guess, because we can’t prove anything, and we can’t make the analysis 100 percent repeatable. Heck, we can’t even make it 60 percent repeatable. Most people are lucky if they do as well as a coin flip.
The irony is that many TA’s actually are correct in their assessment less than 50 percent. That’s because they let their judgement and intuition cloud their analysis. They second guess, they lose patience. So, whatever I tell you, don’t take it as gospel, don’t think I have some uncanny mastery of predicting where the market is going…I’m simply lucky, with a dash of experience, and intuition thrown in.
Anyways, check out the graphic by clicking on it and it will expand to full size. It’s self explanatory, you take away from it what you will. I’m exiting my short position with a small profit because I have no frigging idea where the stock is heading next.