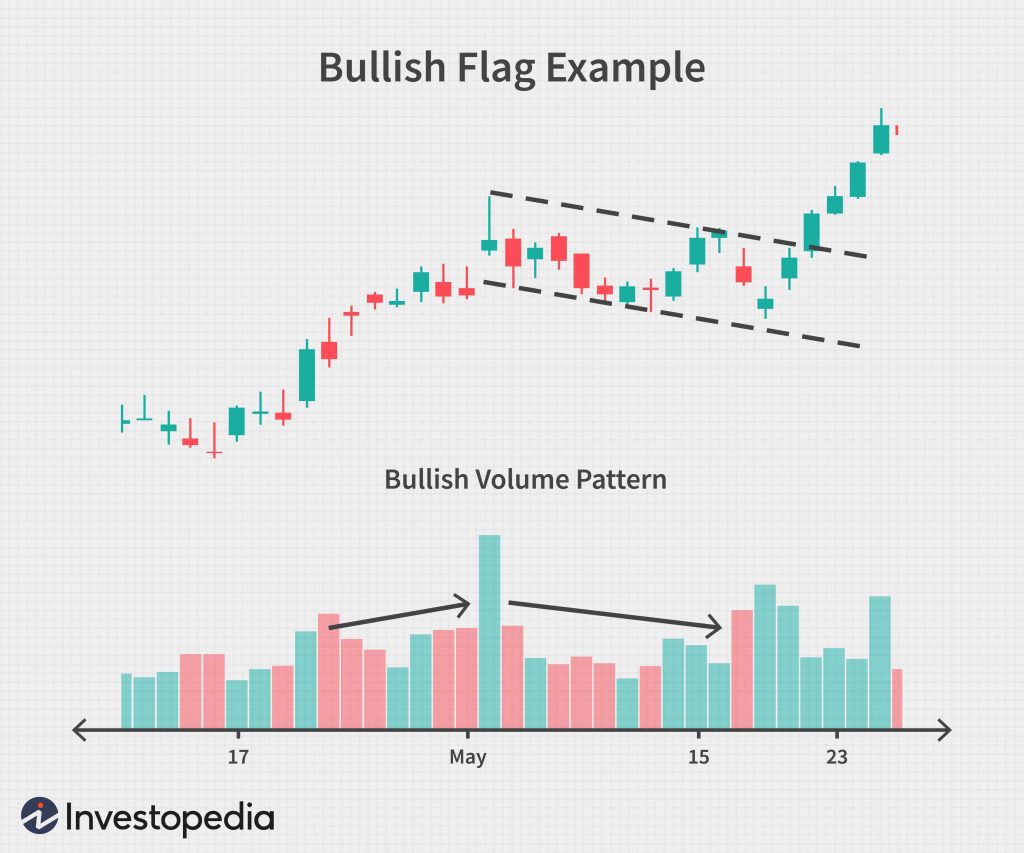
Our AAPL Daily Autotrader is in a short position that it has held since last wednesday (August 21st). It’s interesting that the stock has held support, however it appears to be forming a Bear flag.

AAPL Daily Auto Trader – August 28th
Should support hold, we could see significant upside, however the auto-trader is showing no signs of exiting the trade. And with nearly a 60 percent win rate and profit factor of 3.49, the odds go with the auto-trader. Should AAPL break support, there will likely be a significant correction, as Apple is over-extended.
The Bollinger at the bottom of the chart is plotting the AppleInvestor Money Flow indicator, which is similar to the popular to Worden Brothers Time Segmented Volume. This indicator is also a trading system, and when the mid line turns red, it implies Apple is entering a distribution mode, when it turns blue, it’s in an accumulation mode.

AAPL Daily Equity Curve – click to enlarge
The heart beat indicator is called the “AppleInvestor Look Forward” indicator; it shows the intent of the auto-trader for the following trading day. So in effect, it peers into trader’s likely future direction. Currently there is no signal, so the system is standing pat with the short. Below is the 3 year equity curve, showing an incredibly stable systems trader, with barely perceptible draw down…a very attractive system characteristic.Apple investors want to know what you think, comment below…