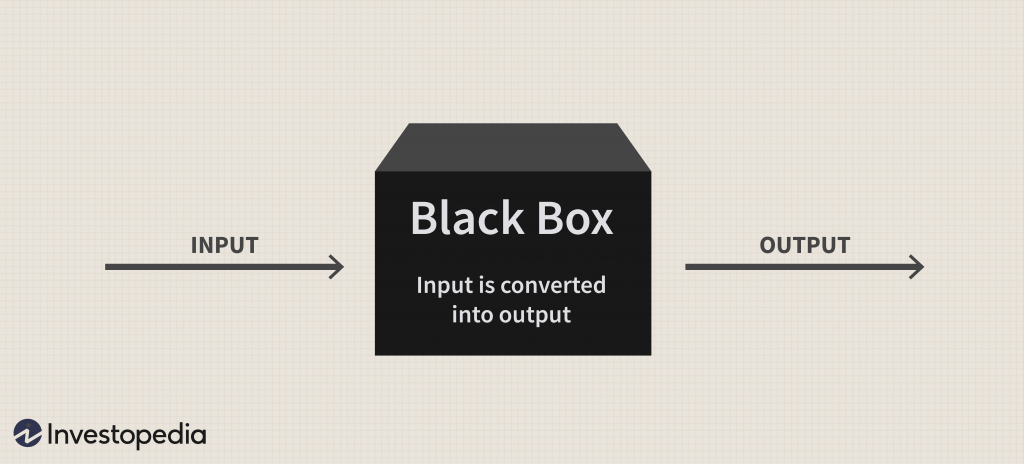
Remember the NeXT logo? It symbolized the Black Box philosophy that Steve Jobs had with computing, which was the basis for the Mac, and virtually every other product that Steve influenced. Now, AppleInvestor is bringing the same philosophy to trading AAPL.
There are millions of Apple (AAPL) traders out there, perhaps the most vocal are those people that buy and hold Apple stock and curse anyone who would consider shorting the company. As an Apple evangelist, I can appreciate their position, but the stock is not always reflective of the company behind the stock.
Then there’s the other half, that trade Apple on a daily basis, for a number of very good reasons. These traders can mostly be categorized into a few big groups, defined by their personal life style and their penchant for risk. There are Day Traders, Swing Traders and Position or Trend Traders (short, medium and long-term, respectively).
Most traders of Apple stock make their entries and exits based on their unique discretion and analysis, perhaps on the news, fundamentals, or technical indicators or chart patterns. Many of them find that the stock is just too high-priced, and so in the absence of a multimillion dollar trading account, they use options to obtain leverage.
Some traders are not so discretionary, and employ a strategy with a strict set of rules, and many of these Strategy-Driven traders also use Black-Box systems, that generate trade signals, based on highly optimized algorithms. These people are by far the most successful traders, not only with Apple, but with all kinds of securities. They traders are generally considered the “Professionals,” the big boys, the institutional players, the guys that can afford the fancy tools and astrophysicists to do complex analysis for them.
There are a few services out there however, that will let you, the Retail Trader, participate in the Big Boy’s game. Only a handful specialize in Apple though, AppleInvestor (my service) is one of them, AAPLTrader is another very good service, run by Micah Lamar, that mostly specializes in options strategies. There are others, but are not exclusive to Apple. Calle me and I’ll let you know who they are…I offer no opinion or endorsement, just the facts.
What I do offer is that Strategy Trading, especially using Black Box systems, is a very effective way to take the emotion out of trading, get a handle on your risk management, and learn a more disciplined way to trade. Your ability to make money will still be determined in part by your ability to stick to the strategy and discipline, and also in part to the effectiveness of the systems.
And so, what you are about to see is a Black Box Day Trader from the AppleInvestor service that trades Apple stock in the 10 minute timeframe. There are other Black Box systems in the service that meet the needs of different trading styles, like Swing Traders and Trend Traders. This system is designed for the active Day Trader that wants to trade a few times a day, and go flat (no position) by the end of day.
A few words of advice, if you are considering such a service…make sure you get the adequate support, and full information on the systems you intend to use.
The following chart shows the 10 minute day trader, called AiT10DT, which stands for the “AppleInvestor 10 min Day Trader.” The system generates both visual signals via a live video stream, and also sends buy and sell alerts to subscribers via Text and private Twitter. This chart shows three trades made yesterday, September 4th, for a total of $2.85. If you had traded 100 shares for each of the three trade signals, that would have amounted to $285 gross profit, after figuring in commissions, slippage and fees, your actual net profit would have been closer to $250.
AiT10DT Day Trader Showing Three Trades
The indicator at the bottom of the chart that looks like a heart beat monitor, is the Buy and Sell Forward Signal. This indicator will pop up or down, indicating the system’s intent to make a trade on the next bar. These are 10 minute bars, so that means the trader gets up to 10 minutes of advanced warning that the system may make a trade and send a trade alert.
Each trade is annotated by the system, showing how many shares are in the position after the trade, and a label describing the type of trade in a kind of short hand. The label indicates the strategy component involved in the trade and the type of trade (short, long, cover, end of day, etc).
Strategy Trading Basics
When you are deciding to trade a strategy, you need to know how that strategy has behaved in the past, so that you can have a reasonable baseline from which to set your expectations for the future. Although, caveat emptor…past performance do not guarantee future results.
You will want to know the following statistical measures of the systems past performance. These are standard things Strategy Traders track, to gauge how they are doing in their trading campaign. If you are not currently tracking these measures, then it will be very difficult for you to tell if what you are doing is a winning or losing strategy, and how you might improve your strategy when you embark on your next campaign. So, as a benefit to you, I have provided a link where you can download the complete statistical report in excel format. Clicking on the performance chart will download the Excel spreadsheet.
The three most important stats for determining performance are the Profit Factor, the win percentage, and the ratio of average win profit to loss. Some would argue that the win percentage is not quite as important as the profit to loss ratio, and I agree. But it sure does feel more comfortable to have more winners than losing trades…but the real deal is how much money is left in your account. Other important factors are the max drawdown, that’s how much the strategy lost in a worst case scenario, and how long the system is in or not in a trade. All of these factors describe what it’s like to trade with this system, and will directly impact your personal tolerance and capacity for risk.
And finally, these last two charts show in a very visual way, what you can expect in terms of profitability from a trader. They are the total accumulated account equity, with the green dots on the chart indicating new equity highs, and the average net profit by month. This is important because some Black Box systems favor certain times of the year over others, and this chart will highlight that characteristic. And as you can see, this trader for whatever reason, does not like January very much.