
AppleInvestor Live Video April 10, 2013 10 AM (click to enlarge)
The screenshot shows LIVE charts on the AppleInvestor website, there are 2 charts. The one on the left is the AppleInvestor AAPL Autotrader, a completely automated trading program, that generates Buy and Sell alerts, as well as money management hints too. On the right is a weekly chart of AAPL showing it breaking out of it’s descending wedge a couple weeks ago, only to return. But now, it’s flirting with that possibility again on the strength in the markets.
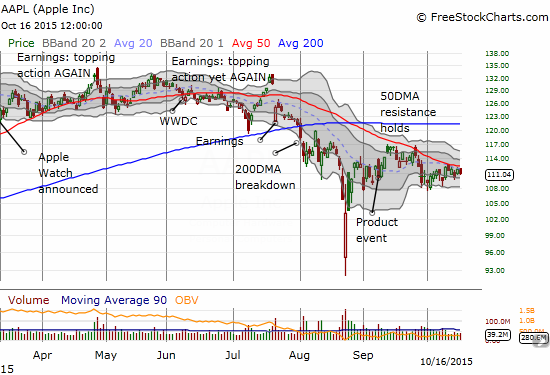
Just below the current price are two technical targets that represent possible bottoms for Apple. The first is 390, which comes from an Elliott Wave analysis, the second is 355, which is the Head and Shoulder target. I have provided several posts that detail each of these analysis.
Over the past several weeks, Apple has completely dislocated from both the S&P and the Nasdaq. All the major indexes have been on a strong bull run, which will likely correct soon. In the meantime, Apple continues to show relative weakness in the face of market strength.
You can watch these charts live on the web by filling out the Registration. It’s completely free, and it will allow you to participate in a chat with me, and anyone else that comes along. I’m available to answer questions about the Autotrader, and how to use it with your trading strategy. I’m also available to talk Apple and the markets. This is a limited time offer, so take advantage of it NOW!
CLICK HERE TO JOIN