The MACD on Apple (AAPL) and the indexes that Apple participates in, like the Nasdaq and S&P, are showing bearish signs in multiple timeframes. The signs include negative divergences on the daily and 60 minute chart timeframes. Also, there are secondary indicators like the RSI and Stochastic that are showing overbought in multiple timeframes as well, from daily to the minute charts.
Now this is not an alert, or meant to be alarmist. It’s simply pointing out a technical fact that should be watched closely and understood. In surging bull markets, stock charts can remain overbought for extended periods of time. But the longer they remain that way, without any kind of unwinding (selling) or consolidation, then the harder they will fall when the pressure becomes too great.
MACD Education
The MACD is an abbreviation for Moving Average Convergence Divergence. The MACD is a primary indicator in Technical Analysis (TA) that measures the momentum of a stock. Like most things in life, some related things have greater importance or weightier affect than others. So, when I say the MACD is a primary indicator, that differentiates it from other indicators, like Stochastic, RSI and Moving Averages; which are all secondary indicators. The primary indicators in TA are, Price, Volume and the MACD. So, when I do an analysis, I weight the effect of the MACD analysis greater than other indicators.

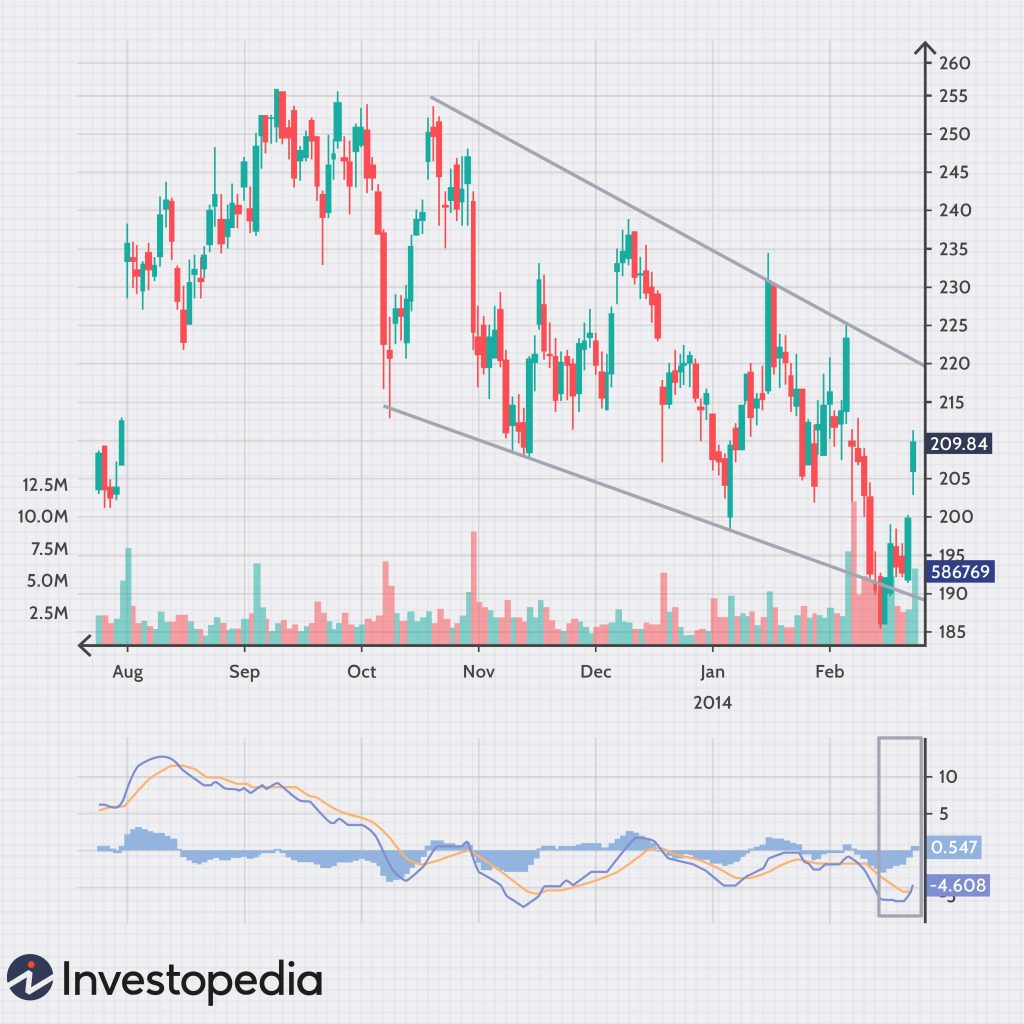
MACD Showing Negative Divergence with the Price Trend, meaning that the price trend is sloping up, while the MACD is negating that trend by sloping down.
Developed by Gerald Appel, Moving Average Convergence/Divergence (MACD) is one of the simplest and most reliable indicators. MACD uses moving averages, which are lagging indicators, to include some trend-following characteristics. These lagging indicators are turned into a momentum oscillator by subtracting the longer moving average from the shorter moving average. The resulting plot forms a line that oscillates above and below zero, without any upper or lower limits. MACD is a centered oscillator and the guidelines for using centered oscillators apply. – courtesy of the StockCharts dot Com website.
The one exception to this rule of primary vs secondary indicators is when there are a confluence of secondary indicators that are confirming one another (all showing a similar degree of overbought or oversold), and/or confirming in multiple timeframes.
Tagged as: AAPL, COMPQ, MACD, Negative Divergence, SPX