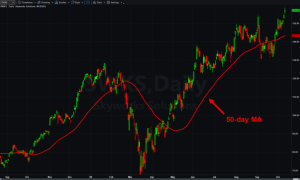
AAPL Daily Chart (click to enlarge)
This is strictly a near term technical analysis of Apple’s stock price, not of the upcoming release of the iPad Mini, if that is what it will be called, nor is it a commentary of expected earnings. However, it is interesting that there is a Head and Shoulders pattern setting up with AAPL stock price on the daily chart.
Many believe that a Head and Shoulder pattern is strong evidence of price reversal, but the statistics do not bear that out. In fact, this pattern is often a continuation pattern of a current trend. The stats give the reversal the slight edge at about 50-55 percent, so by no means should we expect a reversal at this time. It is just interesting to point out the possibility of a reversal, and should the daily price break the neckline of 648 and close below and stay below for a couple days, there is a better than average chance that the pattern will realize a reversal or correction in price.
The potential for the reversal is the height from the neckline of 648, to the recent high of 705, or approximately 57 points. So if we subtract 57 from the neckline, that will give us the correction target, or approximately 591.
The blue line on the chart shows a clear break in a strong uptrend, that started in mid july and broke in early September, at which time it formed the left shoulder of the pattern. There was then a resurgence in price, after the iPhone 5 was released, back-testing the previous trend and failing, to form the head and establishing the neckline at approximately 648. The right shoulder formed over last week’s price action, where Apple finished flat for the week. And it’s now threatening to fall below the neckline to realize a possible reversal or correction in price.
There are three indicators below the price chart. The first is an exclusive buy-sell indicator, called the AppleInvestor Trigger. Blue bars indicate a sell signal, white bars a buy. As you can see, the sell signal was somewhat premature, and would appear to have provided a false signal. The middle indicator measures trend strength using a linear regression algorithm. And as we can see, Apple is in a clear downtrend, as shown with the red bars in the indicator, which have not show any sign of trend reversal yet.
The bottom indicator, called RocRoc, is a Scopelabs exclusive that shows derivatives of relative volatility, showing that volatility is still high, indicating there is a chance for a strong move through the neckline.
If Apple does correct and realizes the potential of the pattern, I would find AAPL to be an very good buy at the 600 price level.